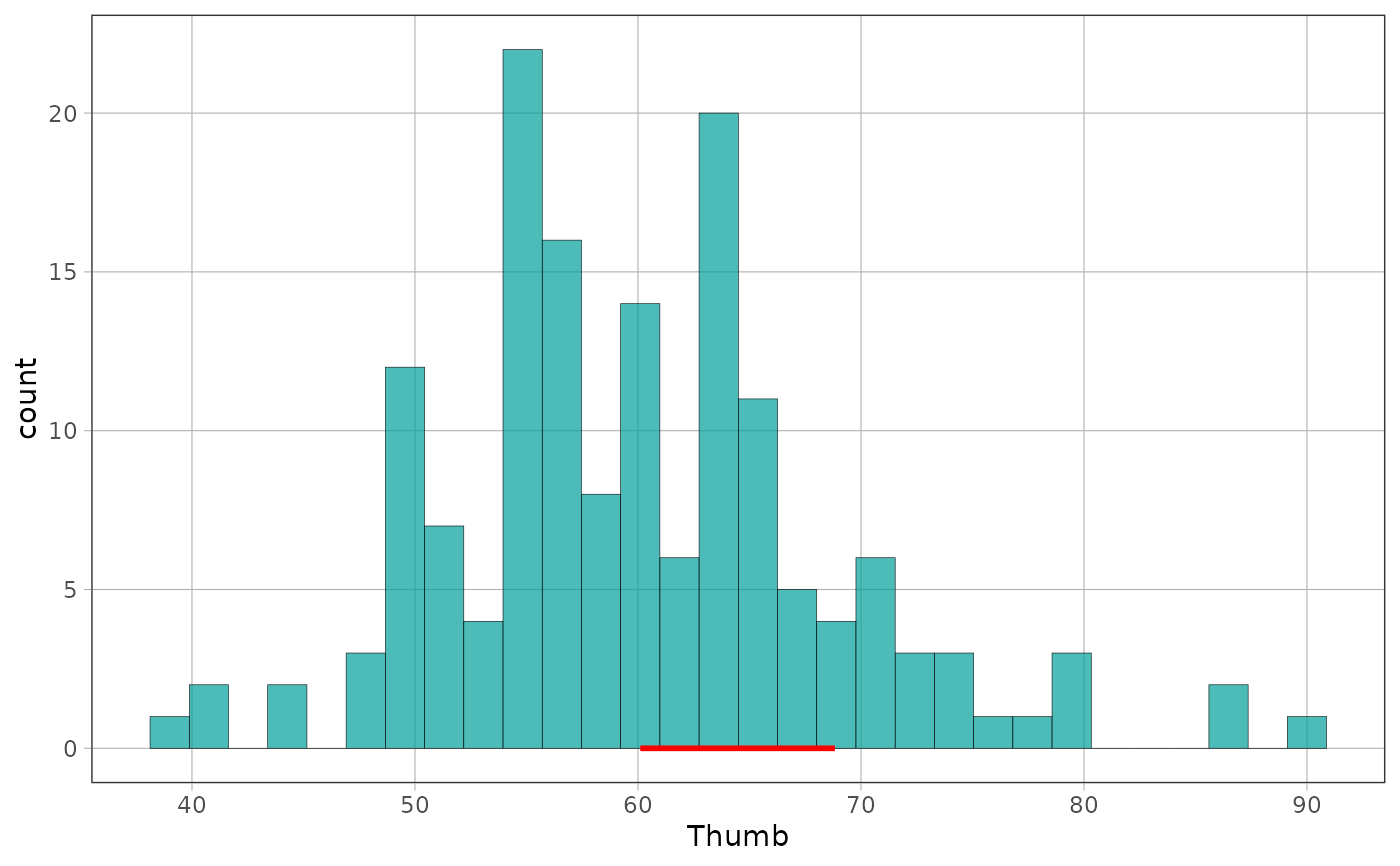
StatSdRuler reduces each panel to the segment for one standard deviation,
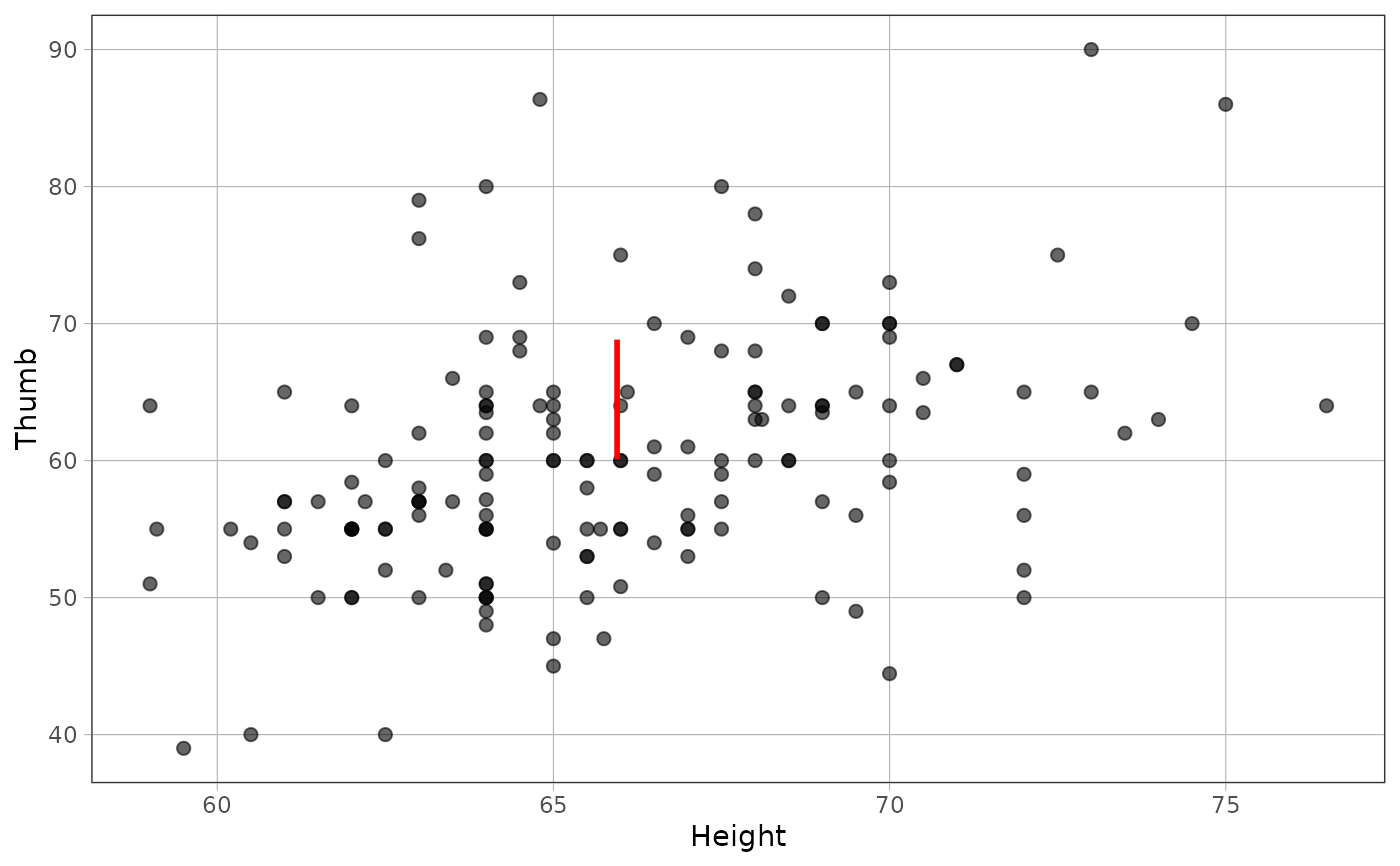
anchored at the outcome's mean. With x and y aesthetics, the outcome is
y; the ruler is vertical and where places it along x. With x alone,
the outcome is x and the ruler runs along the baseline from the mean to
one standard deviation above it.
Usage
StatSdRuler

stat_sd_ruler(
  mapping = NULL,
  data = NULL,
  geom = "segment",
  position = "identity",
  ...,
  where = "middle",
  na.rm = FALSE,
  show.legend = NA,
  inherit.aes = TRUE
)
Format
A ggplot2::Stat object.
Arguments
- mapping
Set of aesthetic mappings created by
ggplot2::aes().- data
The data to be displayed in this layer.
- geom
The geometric object used to display the data. Defaults to
"segment".- position
A position adjustment. Defaults to
"identity".- ...
Other arguments passed to
ggplot2::layer().- where
With both
xandymapped, where to place the ruler alongx:"middle","mean", or"median". Ignored when onlyxis mapped.- na.rm
If
FALSE, the default, missing values are removed with a warning. IfTRUE, missing values are silently removed.- show.legend
Logical. Should this layer be included in the legends?
- inherit.aes
If
FALSE, override the default aesthetics rather than combining with them.
Details
stat_sd_ruler() is the conventional layer constructor. It uses the same
stat as gf_sd_ruler(), so both interfaces measure transformed values and
compute one ruler from each panel's rows. Groups within a panel do not get
separate rulers. Styling aesthetics from the source data cannot be mapped;
set them to one value, or facet the plot to draw one ruler per group.
See also
gf_sd_ruler() provides the ggformula interface.
Examples
ggplot2::ggplot(Fingers, ggplot2::aes(Height, Thumb)) +
ggplot2::geom_point() +
stat_sd_ruler(where = "mean", colour = "red", linewidth = 1)
 ggplot2::ggplot(Fingers, ggplot2::aes(Thumb)) +
ggplot2::geom_histogram(bins = 30) +
stat_sd_ruler(colour = "red", linewidth = 1)
ggplot2::ggplot(Fingers, ggplot2::aes(Thumb)) +
ggplot2::geom_histogram(bins = 30) +
stat_sd_ruler(colour = "red", linewidth = 1)