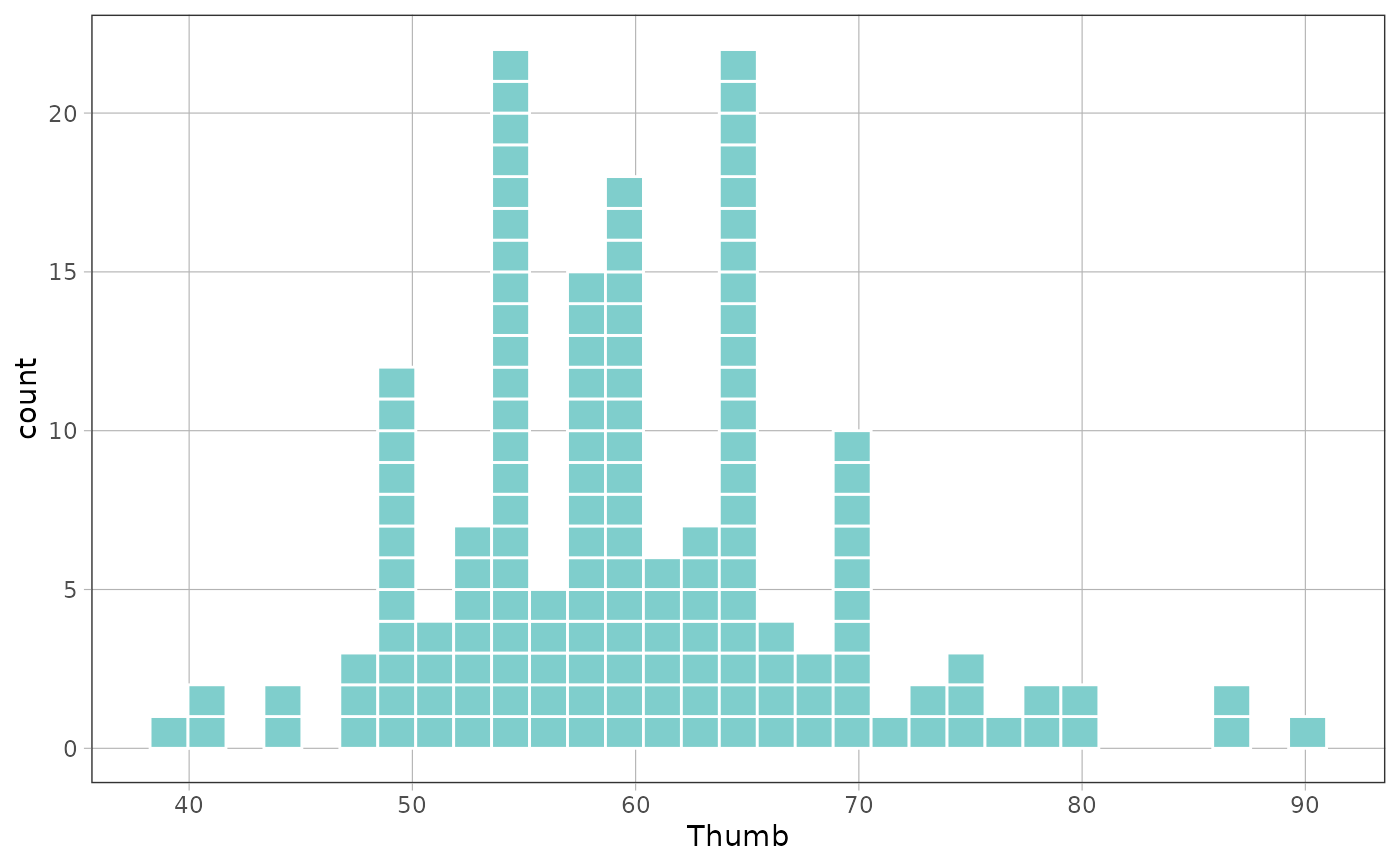
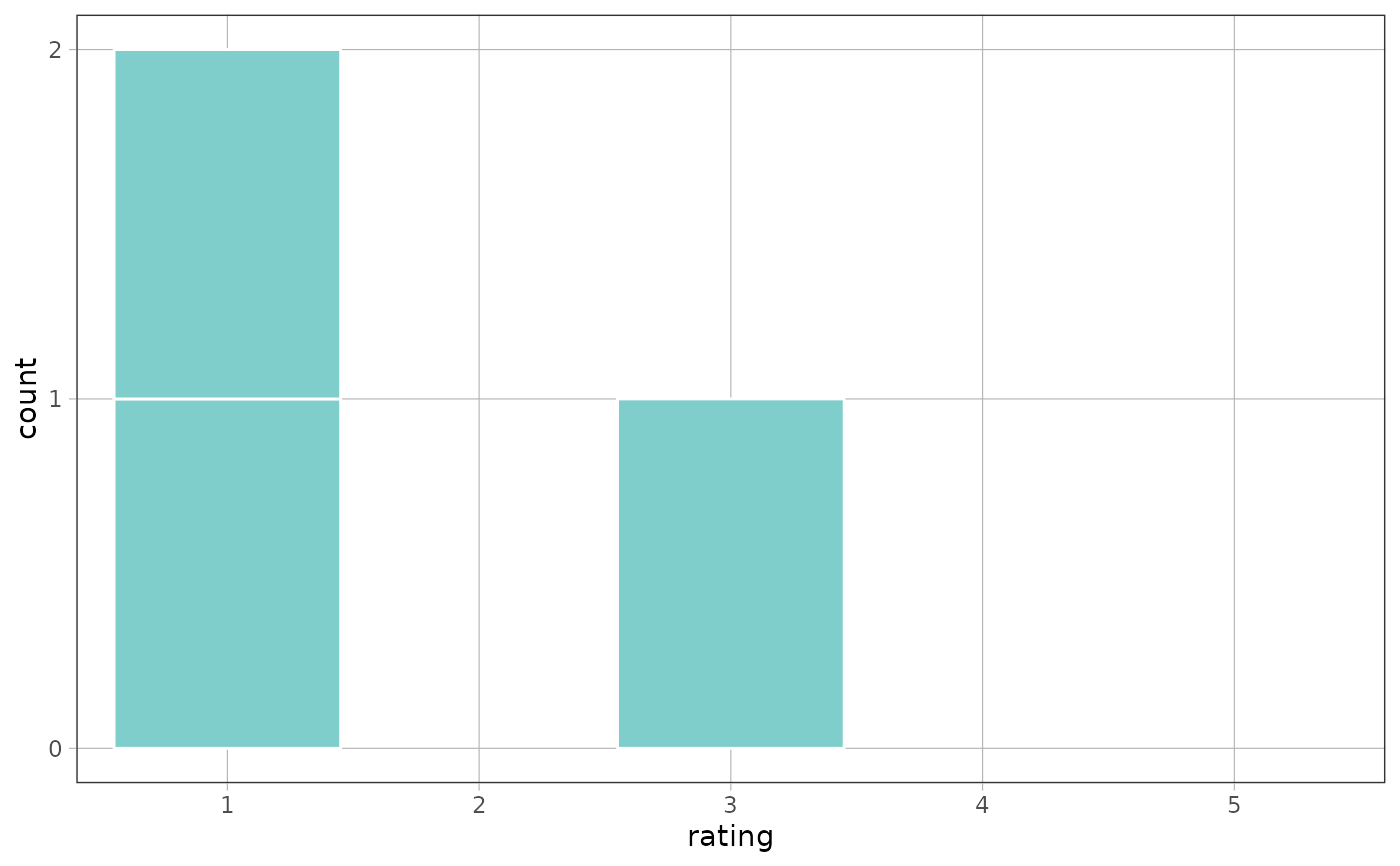
geom_squareplot() and stat_squareplot() expose gf_squareplot() through
ggplot2 syntax. With the default bars = "none", each observation is drawn
as one square. Continuous x values use ggplot2::stat_bin()'s binning rules;
factors, characters, and logicals use ggplot2::stat_count()'s columns.
Both constructors retain gf_squareplot()'s defaults, warnings, factor-level
handling, and count scale.
Counts must be finite, nonnegative whole numbers. Integer frequency weights
are supported; use a histogram or bar plot for fractional weighted counts.
Fill and separator colour inherit mappings, with teal and white defaults
when no mapping or fixed value is supplied.
Put a staged linewidth = after_scale(...) mapping on this layer to keep
its width fixed. Plot-level after_scale() linewidth mappings use automatic
border fitting: ggplot2 evaluates them after the geom's setup.
Usage
geom_squareplot(
  mapping = NULL,
  data = NULL,
  stat = "squareplot",
  position = "identity",
  ...,
  binwidth = NULL,
  bins = NULL,
  center = NULL,
  boundary = NULL,
  closed = NULL,
  breaks = NULL,
  bars = "none",
  na.rm = TRUE,
  show.legend = NA,
  inherit.aes = TRUE
)

stat_squareplot(
  mapping = NULL,
  data = NULL,
  geom = "squareplot",
  position = "identity",
  ...,
  binwidth = NULL,
  bins = NULL,
  center = NULL,
  boundary = NULL,
  closed = NULL,
  breaks = NULL,
  bars = "none",
  na.rm = TRUE,
  show.legend = NA,
  inherit.aes = TRUE
)
Arguments
- mapping
Aesthetic mappings created by
ggplot2::aes().- data
A data frame for this layer, or
NULLto inherit the plot's data. If x is mapped only on the plot's first layer, its data and mapping are used together. Function-valued and formula-valued layer data are not supported.- stat
The statistical transformation used by
geom_squareplot().- position, show.legend, inherit.aes
- ...
Fixed aesthetics and other layer parameters. These include
padfromggplot2::stat_bin().bar_colorandbar_linewidthcontrol the bar drawn bybars = "outline"orbars = "solid".- binwidth, bins, center, boundary, closed, breaks
Binning parameters with the meanings used by
ggplot2::stat_bin(). They have no effect on a discrete x, which is counted instead.- bars
Display style:
"none"draws squares,"outline"frames them with their bars, and"solid"draws the bars alone.- na.rm
Must be
TRUE. A missing value has no square to draw.- geom
The geometric object used by
stat_squareplot().
Details
A squareplot is x-only, as it is through gf_squareplot(). Map the
distribution to x. If the plot already maps y for another layer, set
inherit.aes = FALSE and supply this layer's x mapping directly.