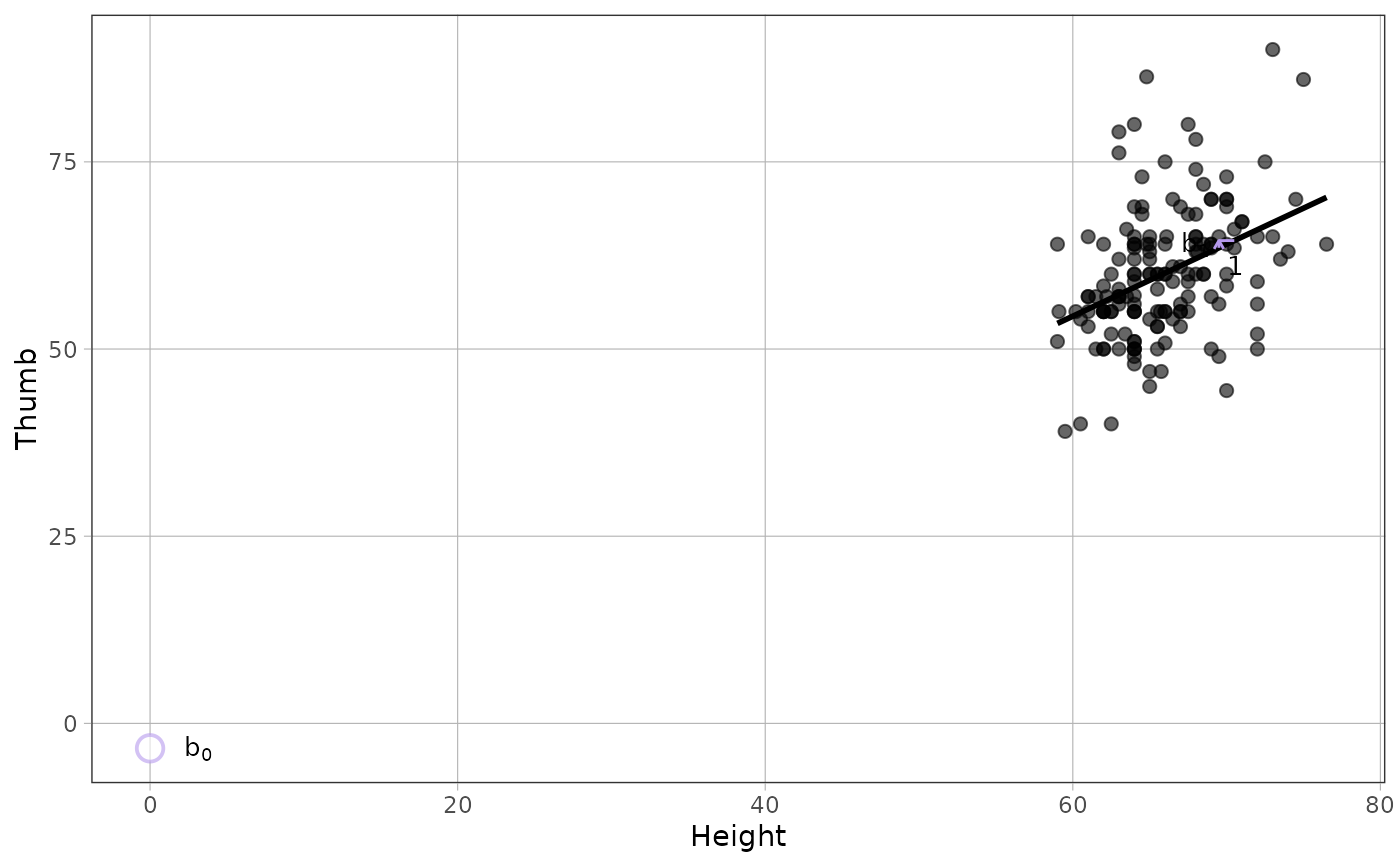
Add an intercept and a rise-over-run triangle, or arrows for group
differences. Marks use tagged segment, point, and text layers.
See gf_b() for the mark geometry and appearance controls.
Usage
geom_b(
  mapping = NULL,
  data = NULL,
  ...,
  model = NULL,
  color = "#b599ed",
  label_color = "black",
  label_size = 3.5,
  arrow_linewidth = 0.5,
  show_b0 = TRUE,
  run = NULL,
  run_x = NULL,
  b0_alpha = 0.3,
  b0_linewidth = 0.8,
  b0_size = 4,
  arrow_nudge = 0.18,
  label_nudge = 0.08,
  inherit.aes = TRUE
)
Arguments
- mapping, data
Optional observation mapping and data. These select the source for this annotation without changing the other layers' source. With inherited data, the annotation reuses the visible source's resolved rows and matching positional mappings. Explicit
datais independent and can also be a function of the plot data.- ...
Unsupported appearance arguments produce a warning. British spellings
colourandlabel_colourare accepted.- model
A model fit by
stats::lm()orstats::aov(), orNULLto use the plot's model.- color, label_color, label_size, arrow_linewidth, show_b0, run, run_x
See
gf_b().- b0_alpha, b0_linewidth, b0_size, arrow_nudge, label_nudge
See
gf_b().- inherit.aes
Inherit the observation source's mappings.
Details
This constructor returns a composite annotation. On addition it selects the
observation source and model layer; its component stats calculate the marks
when the plot builds. The model stat supplies its prediction grid once per
build. Adding the annotation does not evaluate data callbacks or fit a model.
There is no separate stat_b() entry point because an ordinary stat
cannot select a sibling model layer or compose the different drawing geoms.
A supplied model keeps its fitted coefficients. With no model or local
source, the annotation uses the plotted model, or computes an implied model
through StatModel when no model layer is present. An explicit mapping
or data selects the annotation's own source instead of a sibling model.
Scale transformations and hard
limits then affect the inferred fit just as they affect geom_model().
run and run_x use those transformed units for an inferred model.
Scales and limits can be added before or after the annotation. Coordinate
zooming does not change the fitted rows. Replacing plot data updates inferred
coefficients and annotation placement; a supplied fit keeps its coefficients.
Inference requires one model in one panel. Pass a fitted model to annotate a faceted plot. A nonlinear curve has no single slope to annotate. A plotted model must use the identity position: a positional adjustment moves its marks away from the fitted claim.
Examples
fit <- lm(Thumb ~ Height, data = Fingers)
ggplot2::ggplot(Fingers, ggplot2::aes(Height, Thumb)) +
  ggplot2::geom_point() + geom_model(model = fit) + geom_b(model = fit)