![[Experimental]](figures/lifecycle-experimental.svg)
Arguments
- object
A ggplot of one distribution – a histogram, bar chart, density, dotplot, or
gf_squareplot().- part
A distribution part, e.g.
middle(Thumb, .95). Optional: without it, the part is read off the plot's fill aesthetic.- color
Marker/line color. Default
"#1e3a8a".- size
Marker size. Default
4.- show_labels
Whether to annotate the cutoffs. Default
FALSE.
Details
Adds empirical quantile cutoffs for a distribution part – middle(),
tails(), upper(), lower(), or outer(). Short dashed stems end in
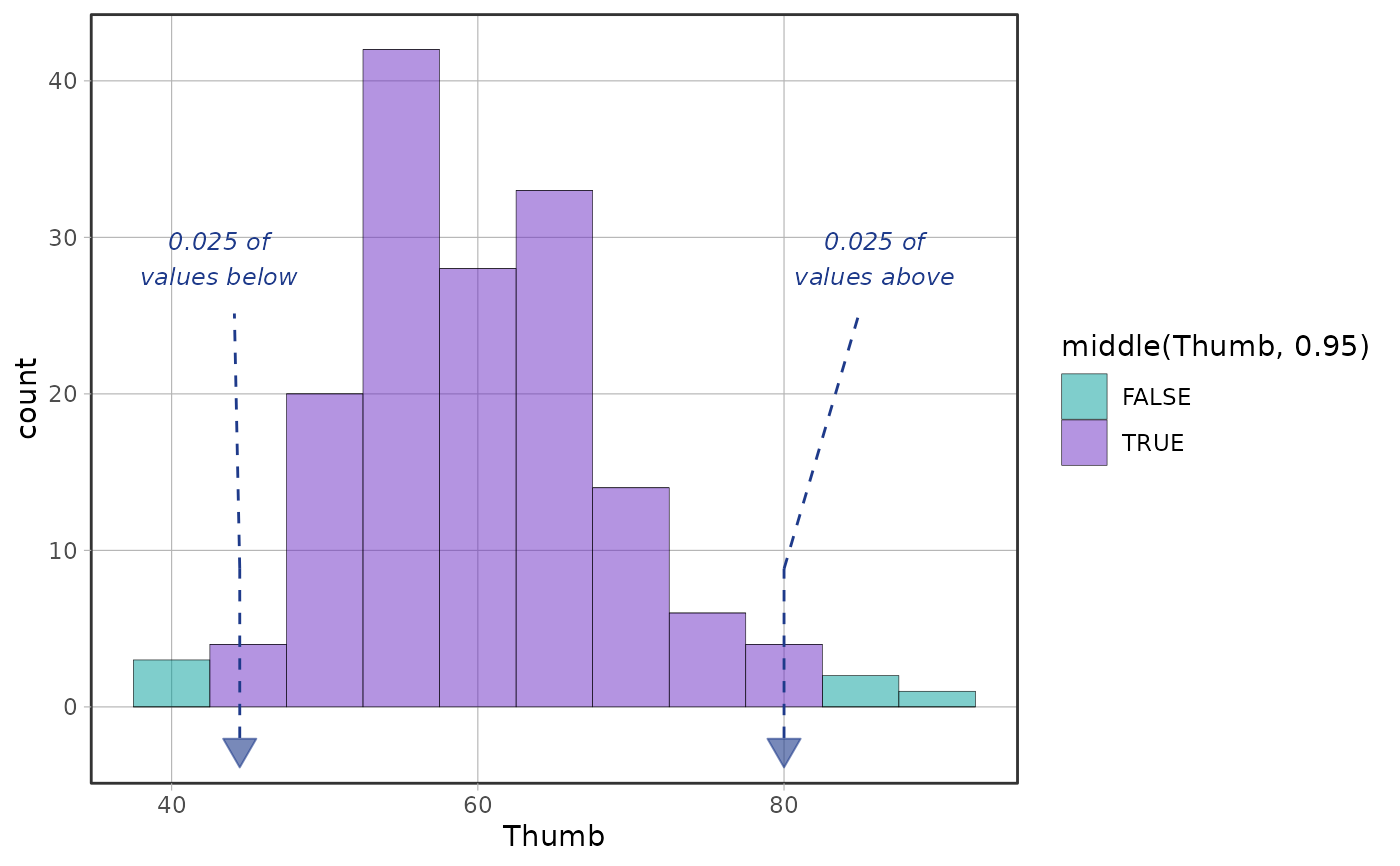
downward triangles that touch the numeric axis. Optional callouts are drawn
in the data panel. Repeated labelled calls are measured and placed together.
Their boxes stay separate when the panel has room, and their routed leaders
remain tied to the exact cutoffs.
In very small panels, leaders use a simple elbow connection if there is no
room for an outward route. Labels keep their text and size, so they may
overlap or be clipped. Enlarge the figure, use fewer facet columns, or set
show_labels = FALSE when labels do not fit.
By default the part is read off the plot's fill aesthetic, e.g.
fill = ~middle(Thumb, .95). Passing part overrides that reading: it marks
whatever part is named there instead, and the fill (if any) is ignored –
marking the 99% cutoffs on a plot shaded for the 95% is a deliberate, lossless
override, not a mismatch.
show_cutoffs() refuses a plot whose first layer does not draw a distribution
(a scatterplot, for instance) and, when part is given explicitly, a part
that names a variable other than the one the plot puts on x.
See also
stat_cutoff() computes the same rule per panel; geom_cutoff()
is the lower-level drawing component. guide_cutoff() can place cutoff
anchors in a position guide instead.
Examples
gf_histogram(~Thumb, data = Fingers, binwidth = 5, fill = ~middle(Thumb, .95)) %>%
show_cutoffs(show_labels = TRUE)
 # an explicit part overrides the fill instead of requiring it to match
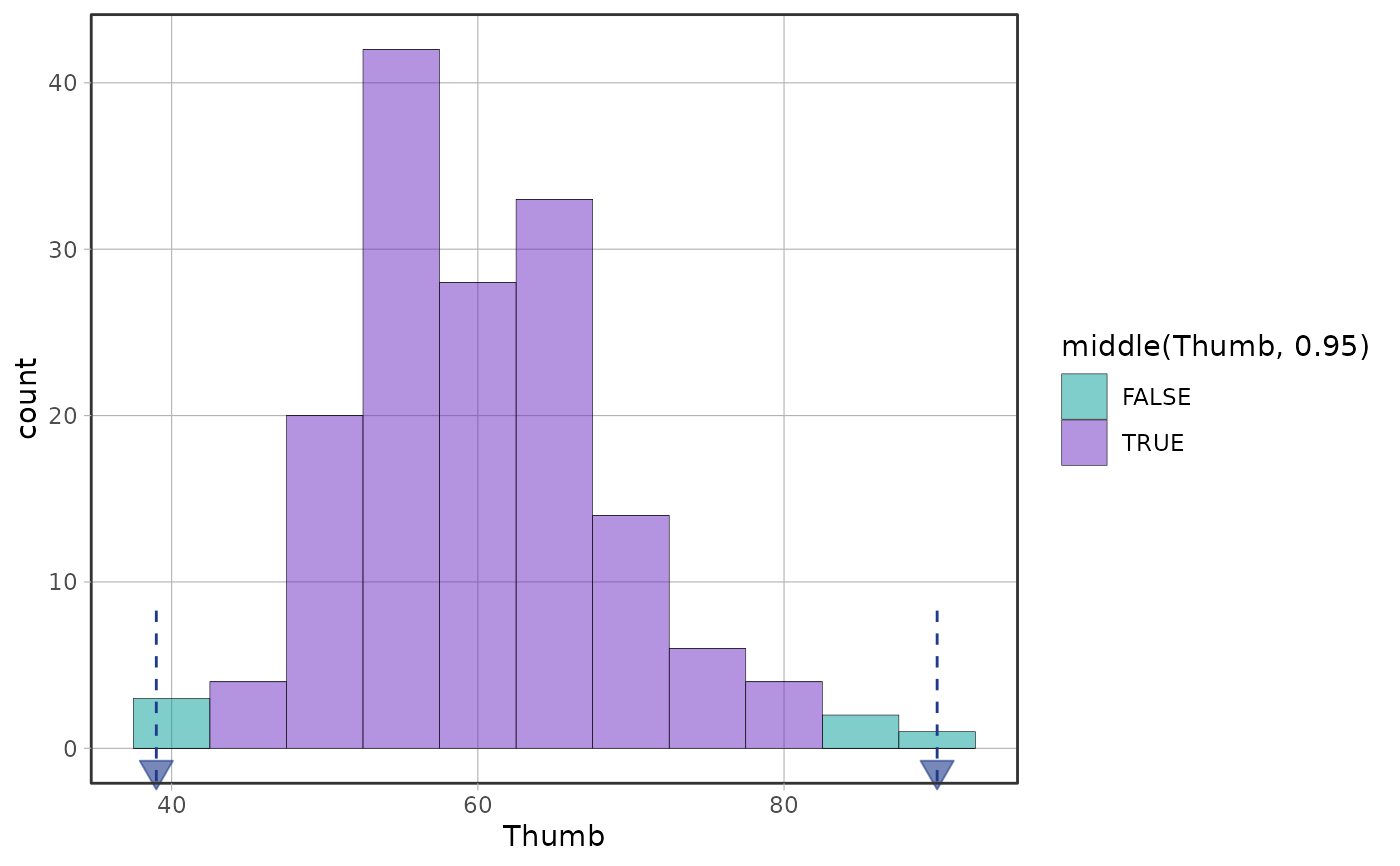
gf_histogram(~Thumb, data = Fingers, binwidth = 5, fill = ~middle(Thumb, .95)) %>%
show_cutoffs(middle(Thumb, .99))
# an explicit part overrides the fill instead of requiring it to match
gf_histogram(~Thumb, data = Fingers, binwidth = 5, fill = ~middle(Thumb, .95)) %>%
show_cutoffs(middle(Thumb, .99))